

Technical Paper
Evaluation of New Mixing Method at NEL flow facility
E. Verloop M.Sc. – KPS – The Netherlands
P. Verloop M.Sc. – KPS – The Netherlands
J. Dods- NEL – UK
B. Pinguet – NEL – UK
E. Sveinsvoll – Aker BP – Norway
S. Øvrebø – Aker BP – Norway
Abstract
Correct measurements of the water content and crude oil composition are essential for an accurate yield allocation. Especially in the cases of maturing production fields or locations where sand in combination with high water contents can be present, unreliable measurements on the quantity of oil being produced can occur resulting in significant measurement errors. Furthermore, with offshore locations commonly having constrained in electrical power, pipework configurations, and footprint size available, this can be a big issue and challenge. A new mixing method for inline blending and pipeline sampling was found to cope with these limitations.
The new mixing technology, e-Jetmixing, made use of the eductor principle and was tested with the support of Aker BP at the NEL low-pressure multiphase facility. A comparison was made between the e-Jetmixer and traditional jet mixing designs. Tests were performed on oil/water flows up to 65 % water cut by volume. The new and traditional mixing technologies were compared for both horizontal and vertical pipeline configurations.
Test results showed that the traditional jetmixer required a high amount of power/energy to reach a homogeneous oil/water mixture and showed the unexpected layering of oil/water at low flowrate regimes. The new e-jetmixing design (with eductor), was tested under the same conditions and reached a homogeneous oil/water mixture with a substantially lower amount of required energy. Furthermore, it was found that the new e-jetmixing design showed a more consistent performance irrespective of the flow conditions, indicating an improvement of the overall measurement uncertainty.
We can conclude that the new e-jetmixing design (with eductor) tested at the NEL facility has proven that a substantial reduction in power required and footprint can be achieved, together with more consistent performance. This paper will detail the advancements on the technology, the test work completed at an independent National Measurement Institute facility and describe the benefits it can offer end users.
Introduction on jet mixing technologies
These days inline jet mixing technologies are widely accepted to mix up pipeline contents temporarily. The jet mixing system consists of a flow take-off quill, a bypass loop, a pump, and motor unit (to externally providing the mixing energy required) and a mixing nozzle assembly through which the process fluid is injected back into the pipeline upstream of the take-off quill. Inline Jet mixing technologies as supposed to inline static mixing devices have many advantages. First, is the turndown ratio; static mixing devices require a minimum flowrate to allow for enough mixing, while jet mixing technologies has proven to create enough mixing at lower flowrates. For applications such as the loading or offloading of ships the flowrate in the main pipeline is subject to ramp-ups and ramp-downs, here jet mixing technologies are widely adopted to mix up the pipeline content and allow for a representative sample to make up or verify the bill of lading. Second, with static mixing devices, the higher the flowrate, the higher the pressure drop is created in the main pipeline. This can be an unwanted situation since it can reduce throughput. Jet mixing technologies create nihil pressure drop in the main pipeline. Finally, static mixing devices obstruct the main pipeline, while jet mixing technologies consist of a mixing nozzle and take off quill which can be removed from the pipeline if considered necessary for pigging of the pipeline or maintenance purposes.
Traditional technologies and Power requirement
There can be challenges and issues with using traditional jet mixing technologies as well. Particularly at offshore locations commonly having constrained in electrical power, pipework configurations, and the footprint size which can be available. Moreover, in the cases of maturing production fields or locations where sand in combination with high water contents can be present, much electrical power is required to mix up the pipeline contents properly.
Unreliable measurements on the quantity of oil being produced can result in significant deviations in measurements and sample composition and consequently provides inaccurate information for oil accounting and allocation.
Accuracy and Reliability in the long term using traditional designs
Furthermore, crude oils are sometimes containing unwanted materials, sediments, and subject to wax formation at ambient conditions. The shape of a traditional mixing nozzle is based on jet flows directed through small holes (e.g. +/- 10 millimetres) to generate the mixing effect for the entire pipeline cross-section. This can make the mixing nozzle sensitive to clogging up, especially when the jet mixing system has not been in operation for a while or after a shutdown. Over time, reductions up to 50% in mixing efficiency in the use of traditional jet mixing nozzles have been observed in field conditions. Unreliable measurements on the quality of oil being produced can occur, resulting in large measurement errors.
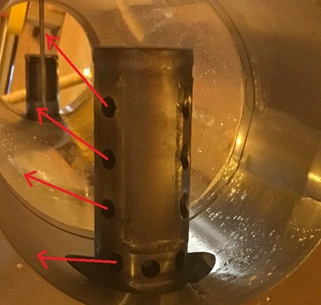
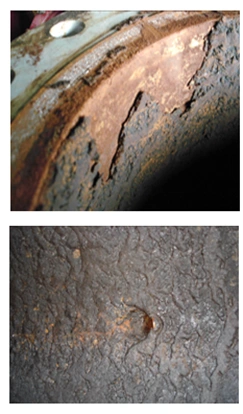
Figure 1: Traditional Jetmixer
Figure 2: Scaling
Introduction of new inline mixing technology
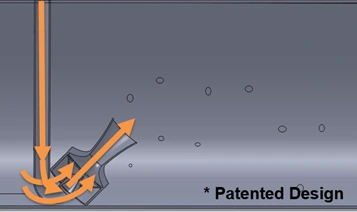
New inline mixing technology presented in this paper optimizes energy requirements of jet mixing systems and eliminates the drawbacks for traditional jet mix designs. More specifically, the mixing nozzle has been redesigned to make it less sensitive to scaling but also to reduce the energy needed to reach enough mixing. The basic principle used is the eductor effect, which is also commonly used to mix up the contents of large storage tanks, but now applied inside a pipeline. The eductor effect allows for a large portion of the pipeline content to be sucked into the mixing element and is turned into a high-velocity jet. Furthermore, the outlet of the mixing nozzle consists of a single large outlet making it less sensitive for scaling. The principle of measurement is pictured in figure 3 below.
e-Jetmixer
Figure 3: Theoretical e-Jetmixer Principle (with eductor)
Initial designs were tested using Computational Fluid Dynamics (CFD) software. Various flow conditions with crude oils varying from light to heavy types and water cuts ranging from 0,1 up to 60% were modelled to study the mixing process of oil and water flows. Although simulations are by nature limited and simplifications of the real pipeline flow conditions, it gives some insight into the expected flow behaviour.
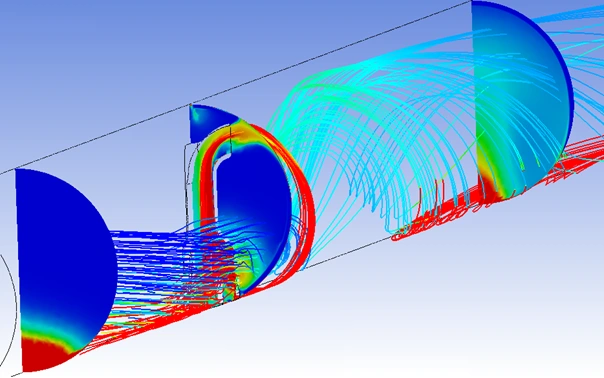
Figure 4: CFD simulations for e-Jetmixing (with eductor) of oil and water
To validate the results from the CFD simulations, the new e-Jetmixing technology was tested with the support of Aker BP at the NEL Low -Pressure Multiphase Facility (LPMF) and compared to traditional jet mixing designs. Tests were performed on oil/water flows up to 65% water cut by volume. The new and traditional mixing technologies were compared for both horizontal and vertical pipeline configurations. Given the limitation in flow capability up to 8-inch pipework at third party flow laboratory for oil/water mixtures, some water injection tests in the field were also conducted on respectively 30-inch, 36-inch, and 40-inch crude oil pipelines. This was to build up experiences with the eductor principle and to validate enough mixing in the field.
The purpose of the test was to evaluate the mixing results of different mixing devices at minimal and reduced loop flow conditions, within the operating envelope of the pump.
Test setup
A jet mixing system was installed at the NEL LPMF consisting of a bypass loop, a pump to provide the mixing energy required and the different mixing nozzle assemblies through which the process fluid is injected back into the pipeline, upstream of the take-off quill.
A control valve was used to regulate the reinjection flowrate, and an ultrasonic flowmeter was installed in the return line to read the actual flow heading towards the different mixing assemblies. A sampler was controlled by a local controller which generated around 1 pulse per 2 seconds, which resulted in a sample of approximately 30 ml/min. Each measurement point consisted of a sample volume of 150 ml per sample, which is estimated to be enough to do a proper sample analysis. Flowrates, line temperature, and pressure were logged for data analysis. The different mixing assemblies were tested at the same flowrate and pressure conditions to allow comparison in terms of performance and mixing energy usage.
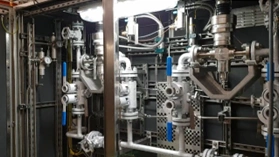 Figure 5: Picture of the sampling cabinet |
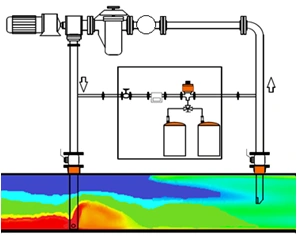 Figure 6: Schematic overview of the test setup (Flowmeter + Sampler + Control valve + Mix nozzle Take off) |
The pipeline test section consisted of an 8” transparent section to record the profile of the mixing devices. A minimum of 20D straight pipe length sections were installed upstream and downstream of the test section to ensure fully developed flow profiles and segregated or partially mixed flows. At the take-off quill, a small pitot tube was set to measure the mixing profile over the height of the pipeline diameter.
The oil and water flows from the main pipe are re-circulated around the test facility using two variable speed pumps after separation. The oil is pumped from the large separator by gravity and then flow thru the reference flow metering section. A side-stream sampling loop and main bypass loop are fitted on the delivery side of the pump to verify any possible contamination. The same configuration exists on the waterside. The bypass loops permit control over the pressure and proportion of each phase inside the main test section; the sampling loops provide information on any cross-contamination in the oil and water process streams. The level of liquid cross-contamination is continually monitored, and the reference liquid flowrates corrected, this means the water-in-oil content of the oil flow stream and the oil-in-water content of the water are under real-time evaluation and correction is applied if necessary, and an associated uncertainty is also provided.
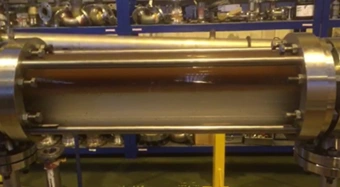 Figure 7: Picture of transparent test section |
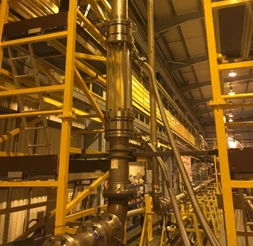 Figure 8: Vertical test setup (Take off Mixing nozzle) |
The different mixer designs were tested at the conditions defined below:
| PARAMETER | RANGE | COND 1 | COND 2 | COND 3 | COND 4 | COND 5 | COND 6 |
|---|---|---|---|---|---|---|---|
| WATER CUT | % | 1% | 2% | 5% | 10% | 30% | 65% |
| PIPELINE VELOCITY | M/S | 0,1 | 0,2 | 0,5 | 1 |
Table 1
This has led to the following total test matrix (19 cases per mixer design):
| Flow \ WC | 1% | 2% | 5% | 10% | 30% | 65% |
|---|---|---|---|---|---|---|
| 0,1 | – | – | X | X | X | X |
| 0,2 | – | X | X | X | X | X |
| 0,5 | X | X | X | X | X | X |
| 1,0 | X | – | X | – | X | X |
Table 2
Low water flowrates were outside the uncertainty range of the flowmeter and the control valve and were not conducted. Furthermore, 5 additional tests were performed to check the uncertainty of the system and its results.
Results for horizontal pipelines
In the horizontal pipeline configuration, tests were conducted at low and high velocities and at low and high-water cuts. The tests performed at different loop flow conditions were evaluated according to the rating method as described in the ISO 3171 (Ref [1]). As per the international sampling standards, sufficient mixing is achieved if the average water content in top of the pipeline divided by the average water content in the bottom of the pipeline is higher than 0,9. The ISO 3171 method calculates the relative water cut deviation as a percentage, meaning the measured difference between the sampled water cut and the actual water cut divided by the actual water cut. The standard distinguishes A (<5%), B (5-10%), C (15-20%) and D (>20%) -rated systems.
At low water cuts and higher pipeline flow velocities (0,5 and 1 m/s), both the traditional jet mixers and the new e-Jetmixer configurations showed acceptable results even at low loop flows with average deviations of around 4-6% (uninterrupted lines). However, the traditional jetmix designs had a broader dispersion of measurement points ranging up to 15% (dashed line), while the new e-Jetmixer showed a much smaller dispersion ranging up to 9% (dashed line), being the maximum deviations indicated in the figure below.
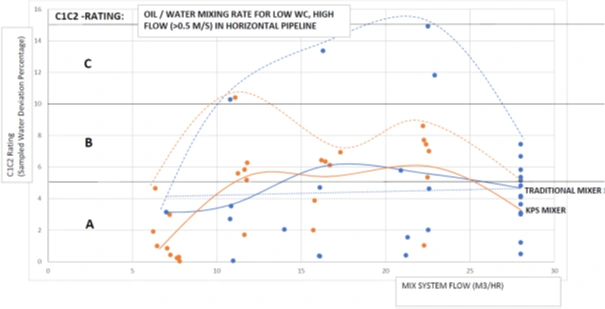
Figure 9: ISO3171 rating at various loop flows for traditional and e-Jetmixing devices at higher pipeline velocities.
At low water cuts and low pipeline velocities (0,1 and 0.2 m/s), the mixing devices showed different results. Where traditional jetmixers showed large deviations over the whole range of loop flows, the new e-Jetmixer showed accurate results at higher loop flows. Traditional designs had a large dispersion ranging from 2% to 15% and even some data up to 27%, while the new e-Jetmixer showed a dispersion range within 5% and a significant improvement versus traditional designs.
The better performance shown in figure 9 for mixing flows below 15 m3/h is most likely to specific flow patterns causing a proper local mixing, but probably not unrepeatable in field conditions. The same behavior can be highlighted for the e-Jetmixer with a mixing flow below 10 m3/hr in figure 10.
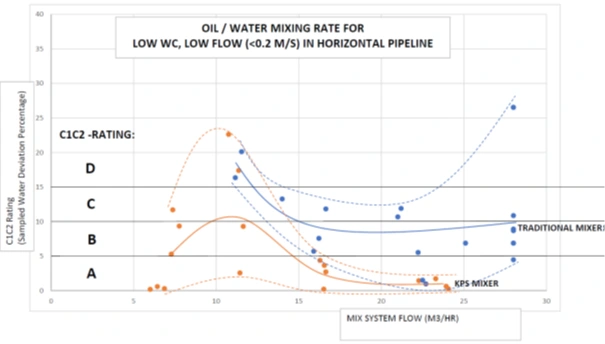
Figure 10: ISO3171 rating at various loop flows for traditional and e-Jetmixing devices at lower pipeline velocities
These claims and results are based on worst conditions where a very light oil is temporarily mixed at low flow conditions and at low water cuts. Notably, the small water cut has effect on the ISO rating performance as the deviation allowance is relative to the actual water cut.
Comparing the various tests performed and all the influential parameters, a simple model was constructed where the collected sample deviation was compared to the ratio between the energy to achieve a homogeneous mix and the added energy by the mixing device.
The horizontal axis of the graphs represents the ratio of the energy amount required in theory to achieve a homogeneous mixture, and the actual energy added by the mixing system using a pump for a mixing configuration. At a ratio of 1 there is in theory just enough energy added by the system to achieve a homogeneous mix. At a ratio smaller than 1, the system adds more energy than required to achieve a homogeneous mix. At a ratio larger than 1, the system adds less energy than theoretically required to achieve a homogeneous mix.
Although data shows a large dispersion, and findings cannot be conclusive, a trend can be extracted as presented with the uninterrupted lines. The dashed lines are showing the datapoint limits or dispersion.
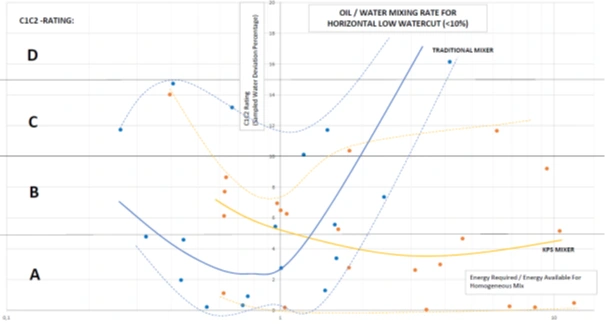
Figure 11: ISO3171 rating at test conditions for traditional and new e-Jetmixing devices at lower water cuts
The traditional mixers show their optimal performance between the ratio of 0.6 and 1, and an A-rating is to be expected between 0.35 and 1.3 on average. At higher ratio, there is not enough energy added by the traditional jetmixer to achieve a homogeneous mixture and the rating rapidly decreases (or the deviation increases). The entire dataset for the traditional jetmixer even contained deviations beyond 30-40% at higher ratio (not shown in figure 11). At low pipeline flowrates, the retention time from a jetmixer to the take-off quill opening is long and water droplets have more time to coalesce and settle again. The direction of the traditional jets being upstream required even longer retention times. Once the system adds far more energy, overmixing occurs, and more water than the average content is “swirled” into the take-off quill.
The results show that the new e-Jetmixer has its optimal design point around a third (1/3th) of the energy ratio as it is very efficiently creating a suction of the water at the bottom and dispersing it in a pattern in the downstream direction. Therefore, the retention time is lower, and the dispersion of the water is performed more efficiently. Even at a very high ratio, which means there is far less energy injected than usually required to achieve a homogeneous mixture, there is still an averaged water content “swirled” into the take-off quill.
Since the e-Jetmixer requires a lower amount of energy than the traditional jetmixer, the overmixing effect starts earlier. As similar to the traditional jetmix models, the data spread, is relatively large at a higher ratio.
At higher water cuts, we can see a similar behavior as for low water cuts can be highlighted. Although the allowed deviation should be more significant due to the large water cut, there is more energy required to mix the water homogeneously over the cross-sectional pipe area. The basic droplet model, as described in the ISO standard (Ref [1]), is not applicable for higher water cuts as simple droplets are not the main drivers in such conditions, indeed break up of segregated flows into larger sections and eventually into dense droplet phases and even into emulsions can occur. Therefore, the ratio of 1 between required and added energy is not evident, but still can be used for the performance evaluation.
Like the low water cut results, the traditional jetmixers show rapid increasing deviations (or decreasing rating) when energy from the loop is reduced. When the ratio is lower than 1 (more energy is added than required), it is unknown what the results are as there were not enough data points collected. The new e-jetmixer (with eductor) showed a similar trend, where the rating is much better than traditional mixers.
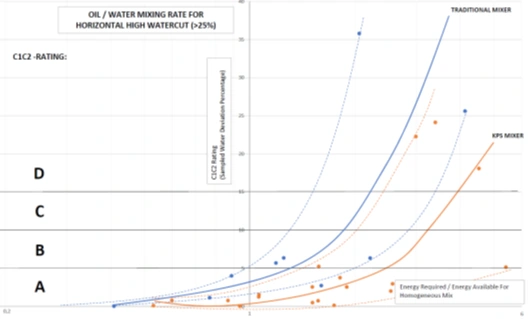
Figure 12: ISO3171 rating at test conditions for traditional and new mixing devices at higher water cuts
Although the data collected was limited and occasionally showed large deviations, we can find a trend when comparing the different mixture models. It is expected that some of the large deviations are caused by the strong coupling of the efficiency of the mixing device and the introduced pump flow, which was changed continuously during the test. However, comparing the data to similar tests previously performed with traditional jetmixer, the data are consistent.
Results for vertical pipelines
Similar tests were conducted for vertical pipelines, and although data set was limited, most of the data points are within the A-rating margin with a deviation of 0 to 5%. Due to the vertical orientation, the gravity (and therefore settling rate of droplets) works in the same direction as the pipeline flow (downward flow in this experiment). As the flow velocity is higher than the settling rate of the droplets, droplets are quickly breaking and scattered over the cross-section of the pipe. Figure 13 is showing some of the results from this test work.
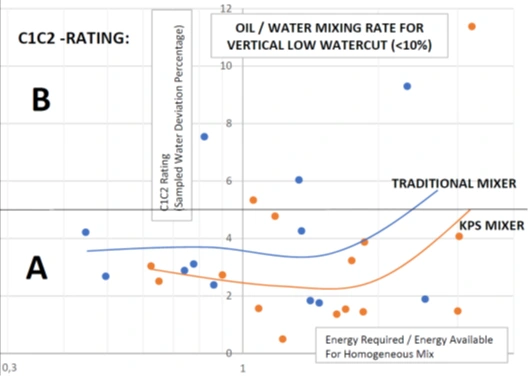
Figure 13: Vertically oriented pipeline flows for low water cuts
The test was only performed with the flow direction downward and not with the upward flows which could lead to some slugs under specific conditions, and they would influence the overall performance, and therefore no upward flow condition was tested.
Findings
At worst process conditions where a light oil with low water cut and at a low pipeline velocity are flowing, the test results clearly show that the e-Jetmixer (with eductor) requires less energy to achieve an acceptable representative mixture than the traditional jetmixer. This is mainly through efficient use of its energy by the dual function of suction of the water layer and mixing of the layer in the partial downstream direction, while, at the opposite, the traditional jetmixer model only mixes by introducing jet eddies in the upstream direction.
Low water cuts
When flow velocities increase and the flow regime cannot be considered laminar anymore, both the traditional jet mixers and the new e-Jetmixer (with eductor) configurations showed acceptable results even at low mixing flows with average deviations of around 4 to 6%. However, the traditional designs had a more significant dispersion ranging up to 15% (multiple C-rating points), while the new e-Jetmixer showed a much smaller dispersion below 9% (A and B ratings). With this said, the allowed deviation to achieve specific ratings is very strict. For example, a water cut of 1% only allows for a deviation of 0,05% to achieve the A-rating.
High water cuts
When high water cuts are present, the test results clearly show again that the e-Jetmixer (with eductor) requires less energy to achieve an acceptable mixture than the traditional jetmixer.
One would expect the deviation to increase when the energy ratio is 1 or larger (less mixing energy added than required). The spread or deviation is expected to become far more significant due to the mixture uncertainty. This expectation is found with the traditional jetmixers, however with the e-jetmixer (with eductor) the results show a far lesser increase of the deviation. As soon as the loop flow was increased above the standard required flow (ratio smaller than 1), some of the measurements showed a more significant deviation. It is expected that this would be the result of overmixing, where more water than the cross-sectional average would be “swirled” into the take-off quill.
Vertical lines
Vertical orientations show good performance ratings and deviations of both mixers within the allowable tolerances. Like the horizontal pipelines, the e-Jetmixer device (with eductor) shows a better performance rating or less deviation at lower energy ratio from the mixing loop than traditional mixers.
If we are comparing the collected data to similar tests previously performed on traditional jetmixer, the data is consistent.
Test work conducted in the field
To build up experiences with the eductor principle and to validate enough mixing; test work was conducted at different crude oil sites. Water proving tests have been conducted as per either the API MPMS chapter 8.2 (Ref [3]) or the ISO 3171 standards (Ref [1]). Water proving tests presented in the table below shows the performances of the e-jetmixer at three different line sizes.
| Application | Water% injected | Viscosity | Density | Accuracy |
|---|---|---|---|---|
| 30-inch crude oil pipeline | 1,56% | 1,3 cSt | 770kg/m3 | A-rating |
| 36-inch crude oil pipeline | 1,46% | 6,4 cSt | 840kg/m3 | A-rating |
| 40-inch crude oil pipeline | 1,94% | 1,4 cSt | 780kg/m3 | B-rating* |
Table 3
The results showed a performance in the field for line sizes as large as 40 inches in line with the expectation and test made in flowloop laboratory (LPMF).
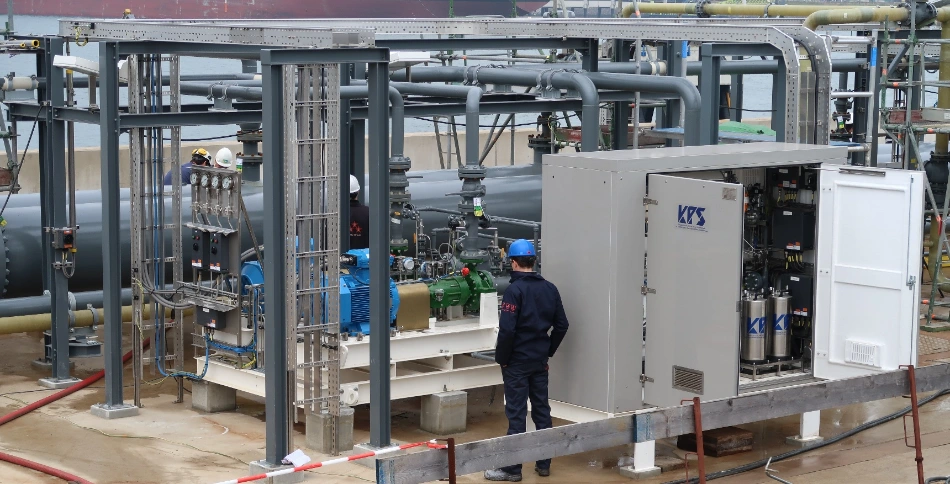
*The B rating for the 40-inch application has been caused by the non-ideal pipeline configuration situation of the test setup, and not the performance of the mixing design itself as the test baselines, and water injection phases showed lag due to unavoidable water traps. A picture of the e-jetmixer design installed and used for field testing purposes is presented in figure 14.
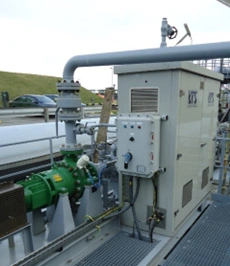
Figure 14: Field installation of e-Jetmixer
Conclusion
The traditional jetmixer and e-jetmixer (with eductor) were tested under the same conditions for both low water cut as well as high water cut applications. Test results show that the traditional jetmixer require a more substantial amount of energy to reach a homogeneous oil/water mixture. This would mean that there is an opportunity to use a smaller pump which is requiring less power for the e-jetmixer (with eductor) than for the traditional jetmixer. Furthermore, the test results show that as soon as the traditional jetmixer adds less energy than required to the process, it can show a significant deviation. Apart from cases where traditional jetmixers are installed and turn out to be undersized in the design phase, there can be cases such as the equipment ageing where over time a significant decrease in mixing performance can occur with traditional jetmixers.
In comparison, t he e-Jetmixer shows a much more consistent performance even though less energy than required is added to the process. This would mean that for cases where the mixing energy required cannot be met an improvement of the overall measurement accuracy can be achieved with the usage of an e-Jetmixer design, especially for applications where crude oils can contain unwanted materials, sediments, or wax appearance at ambient conditions and potentially affecting the mixing performance of traditional jet mixers. Significant measurement errors can be prevented with the usage of the e-Jetmixer design (with eductor). Furthermore, applications such as maturing production fields (brownfield) or locations where sand in combination with high water contents can be present, significant measurement errors can be prevented, and more reliable measurement on the quantity of oil being produced can be made.
References
- [1] EN ISO 3171:1988 Petroleum liquids — Automatic pipeline sampling standard.
- [2] Technical Committee: ISO/TC 28/SC 2 Measurement of petroleum and related products
- [3] API MPMS Chapter 8.2: 2016 Standard Practice for Automatic Sampling of Petroleum and Petroleum Products, Fourth Edition
Recent Comments